 Course Outline
Multivariate Data Analysis
Psychology 6140
Psychology 6140 is designed to provide an integrated, in depth, but
applied approach to multivariate data analysis and linear
statistical models in behavioural science research.
There is a strong emphasis throughout the course on
graphical methods for visualizing data and the results of
statistical models.
The
statistical topics covered will include:
- Regression analysis
- Univariate and multivariate ANOVA and ANCOVA
- Discriminant analysis
- Canonical correlation analysis
- Principal components and factor analysis
- Cluster analysis, Multidimensional Scaling and/or Logistic regression
(as time permits)
Most of these methods are actually special cases of the General
Linear Model. By developing these techniques within this
framework, the student is led (hopefully) to appreciate the
conceptual unity underlying all forms of regression and all
analysis of variance designs, both univariate and multivariate.
This unification of these seemingly different forms of analysis
is achieved through the use of matrix algebra to formulate the
various models. Therefore, the first part of the course (about 5-6
weeks) is devoted to the necessary mathematical skills.
If you wish you can get an early start on this part by looking at my
description of matrix algebra preparation for the course.
Although all of the matrix algebra required for the course will
be covered in the readings and lectures, time constraints dictate
that this treatment will be somewhat brisk, and either a modicum of
initial familiarity or a willingness to work hard will be assumed.
In order to facilitate exercises and homework problems which
involve matrix operations, students will be given instruction in
using a computer package for matrix algebra.
Software Notes:
In the lectures and lab sessions, I will use both SAS and R for
examples and tutorials.
Most of the practical assignments and graded work can be done with
any software you are comfortable with; however excercises using
matrix algebra will probably be most convenient in
SAS/IML or R (or JMP or Matlab).
Both R and SAS/IML
provide students with the equivalent of a "matrix
desk calculator" which makes exploration and learning quite
efficient; the facilites of SAS provide the power and data
management facilities needed for larger projects.
There are two principal texts for the course, and one text on matrix
algebra
(Green etal.).
For most topics in the course, parallel readings are assigned in
Johnson & Wichern and Tabachnick & Fidell.
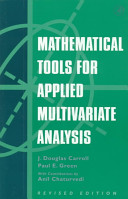
- Green, P.E., Carroll, J.D & Chaturvedi, A. Mathematical tools for
applied multivariate analysis,
[Amazon web site]
Academic Press, (Revised
Edition), 1997.
[ISBN 0-12-160955-3]
{there are copies of the old edition in the Psychology Resource Center and online copies of some chapters
in a password-protected area.}
- Johnson, R.A. & Wichern, D.W. [brief desc.] Applied multivariate
statistical analysis
[Pub. web site], Pearson Education,
2013, 6th Ed. revised [ISBN-13: 9781292024943; (copies of 6th Ed. in Scott/Steacie, QA 278 J63 2007)]
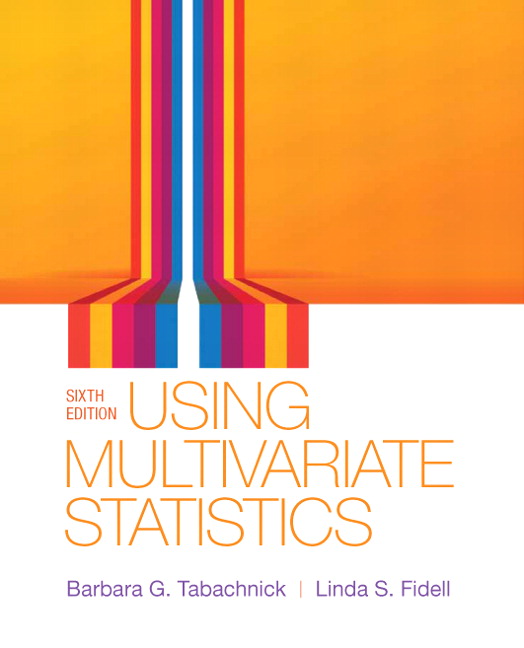
- Tabachnick, B. G. & Fidell, L. S. [brief desc.] Using Multivariate
Statistics
[Pub. web site]
Allyn & Bacon, 2013, 6th Ed. [ISBN-13: 9780205849574; QA 278 T3 2013
(copies in Scott/Steacie of 6th Ed)] Also of interest:
Companion website for the book
with data files for the examples.
In addition, you may want to use one or more of the following for
reference or supplementary reading. The first two provide alternative
readings for some sections of the course, and are available in the
Psychology Resource Center.
The others relate to computing resources.
- Morrison, D. F. Multivariate Statistical Methods
(3rd ed.), 1990. New York: McGraw-Hill.
- Stevens, J. Applied Multivariate Statistics for the
Social Sciences, 4th ed., L. Erlbaum Associates 2002.
[ISBN 0-8058-3777-9]
- Friendly, M. SAS System for Statistical Graphics, First Edition., SAS Institute,
1991. [ISBN 1-55544-441-5; everything you wanted to know about statistical graphics.]
- Friendly, M. Visualizing Categorical Data., SAS Institute,
2000. [ISBN 1-58025-660-0]
Grades in the course will be based on one take-home exam, one
mid-year project
(a data analysis project), and one end-year data analysis project: three units,
each worth 33.3%. See Projects for details
on all but the first take-home exam (on matrix algebra).
The two data-analysis projects will involve research reports
involving analysis of either existing data or your own. The first
will focus largely on regression techniques.
The final project should be based on methods of the second
half of the course using either existing data or your own.
My intention is
that you learn to execute, interpret and write the results of
multivariate analysis.
There will also be frequent assignments and problems throughout
the course, which I will review in class. Assignments will not be
graded, but are an essential part of your learning. You should
plan to devote 3-4 hrs/week to assignments. At first there will be
a lot to learn about the mechanics of using the computer system
itself, but it will get easier as you progress.
- Part I: Statistical and mathematical background
- Overivew of multivariate methods [Lecture slides]
- Graphical techniques for multivariate data [Lecture slides]
[tutorial: Intro to SAS for Windows ]
- Data screening [Lecture slides]
[tutorial: Data Exploration and Graphics with SAS]
- Matrix algebra
- Multivariate distribution theory
- Part II: General Linear Model
- Regression analysis
- Hotelling's T2
- Multivariate analysis of variance
- Analysis of covariance
- Discriminant analysis
- Loglinear models for categorical data (if time permits)
- Part III: Dependence among variables
- Canonical correlation
- Principal components analysis
- Factor analysis
- Cluster analysis
- Multidimensional scaling (if time permits)
This is just a rough sketch of the initial readings on matrix
algebra. See the individual assignments or the
lecture/reading schedule
for details (those are updated).
Some students like to have an alternative
source for reading about certain concepts. Where possible, I've
included parallel readings from Morrison and/or Stevens, but if
you've read the G&C material without trouble, that should be
sufficient.
Note:
TBD=to be distributed;
PRC=Psychology Resource Centre;
G&C=Greene & Carroll;
J&W=Johnson & Wichern;
T&F=Tabachnick & Fiddell.
- Graphical techniques: Friendly, Statistical graphics
for multivariate data, SAS SUGI Conf, 1991 (TBD);
Wainer, H. Graphical data analysis, Ann. Rev.
Psychol., 1981 (PRC); Chambers et. al. Graphical
methods for data analysis, Chapter 5 (PRC)
- Overview: G&C, Chapter 1; J&W, 1.1-1.4. T&F, Ch 1-2
- Data screening: T&F, Chapter 4.
- Basic vector and matrix operations: G&C, Chapter 2:
2.1-2.6; J&W, Supplement 2A Stevens, Chapter 2: 2.1-2.3;
(Morrison, Chapter 2: 2.1-2.3)
- Determinant & Inverse: G&C, Chapter 2: 2.7-2.9; Stevens,
Chapter 2: 2.4-2.5; (Morrison, Chap. 2: 2.4-2.5)
- Vector geometry: G&C, Chapter 3; J&W, 2.1-2.2;
- Linear transformations & rank: G&C, Chapter 4;
(Morrison, Chap. 2: 2.6-2.7)
Computer work for the course can be done in the Hebb lab, Rm. 158/159 BSB.
You will need an individual account on the Health Psychology Lab, which you can create
yourself using York's Manage My Services application.
In general, you will probably find your course work easier if you install R, SAS
(and/or SPSS) on your home computer/laptop.
You can purchase licenses/CDs for these via
York's Group License page
.
You can download R software for free.
It is also possible to run SAS and SPSS at home via York's
WebFAS service, but I haven't tested this directly.
Data files for the course, example R and SAS programs, assignments and other
documents will be available in the Hebb Lab and via the web.

© 2005-- Michael Friendly
Author:
Michael Friendly
Email: friendly AT yorku DOT ca
 Course Outline
 Course Outline


